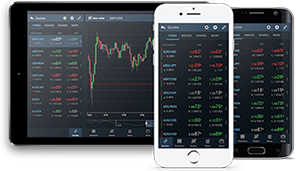
Our flagship trading app is available for Android, iOS and Windows Phone. It has been designed for the active trader, focusing on functionality, accessibility and security. With Delta Trading Mobile you are always on top of your trading, even when on the go. Learn More »
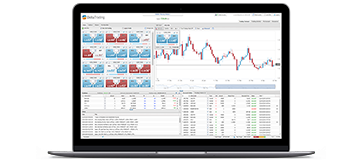
Highly customisable, browser-based platform, allowing you to trade 1000+ markets from any computer or tablet with an Internet connection: advanced charting, intuitive layout, full set of order types. Learn More »
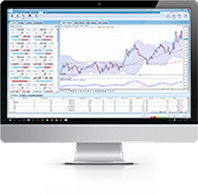
Our proprietary FOREX and CFD trading platform is available as a standalone installation for Windows OS. Benefit from its professional analytical and charting tools while enjoying the rich customisation capabilities and intuitive interface. Learn More »
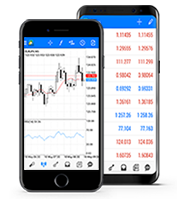
Access your MetaTrader 4 account from any Android or iOS device and trade with full mobile functionality. Open and close positions, monitor the markets and perform technical analysis straight from your smart device. Learn More »
Trade FOREX and Precious Metals on one of the most popular trading platforms in the world and benefit from its professional charts, custom indicators and automated expert advisors. Let our excellent customer service team support you along the way. Learn More »